claude-mods
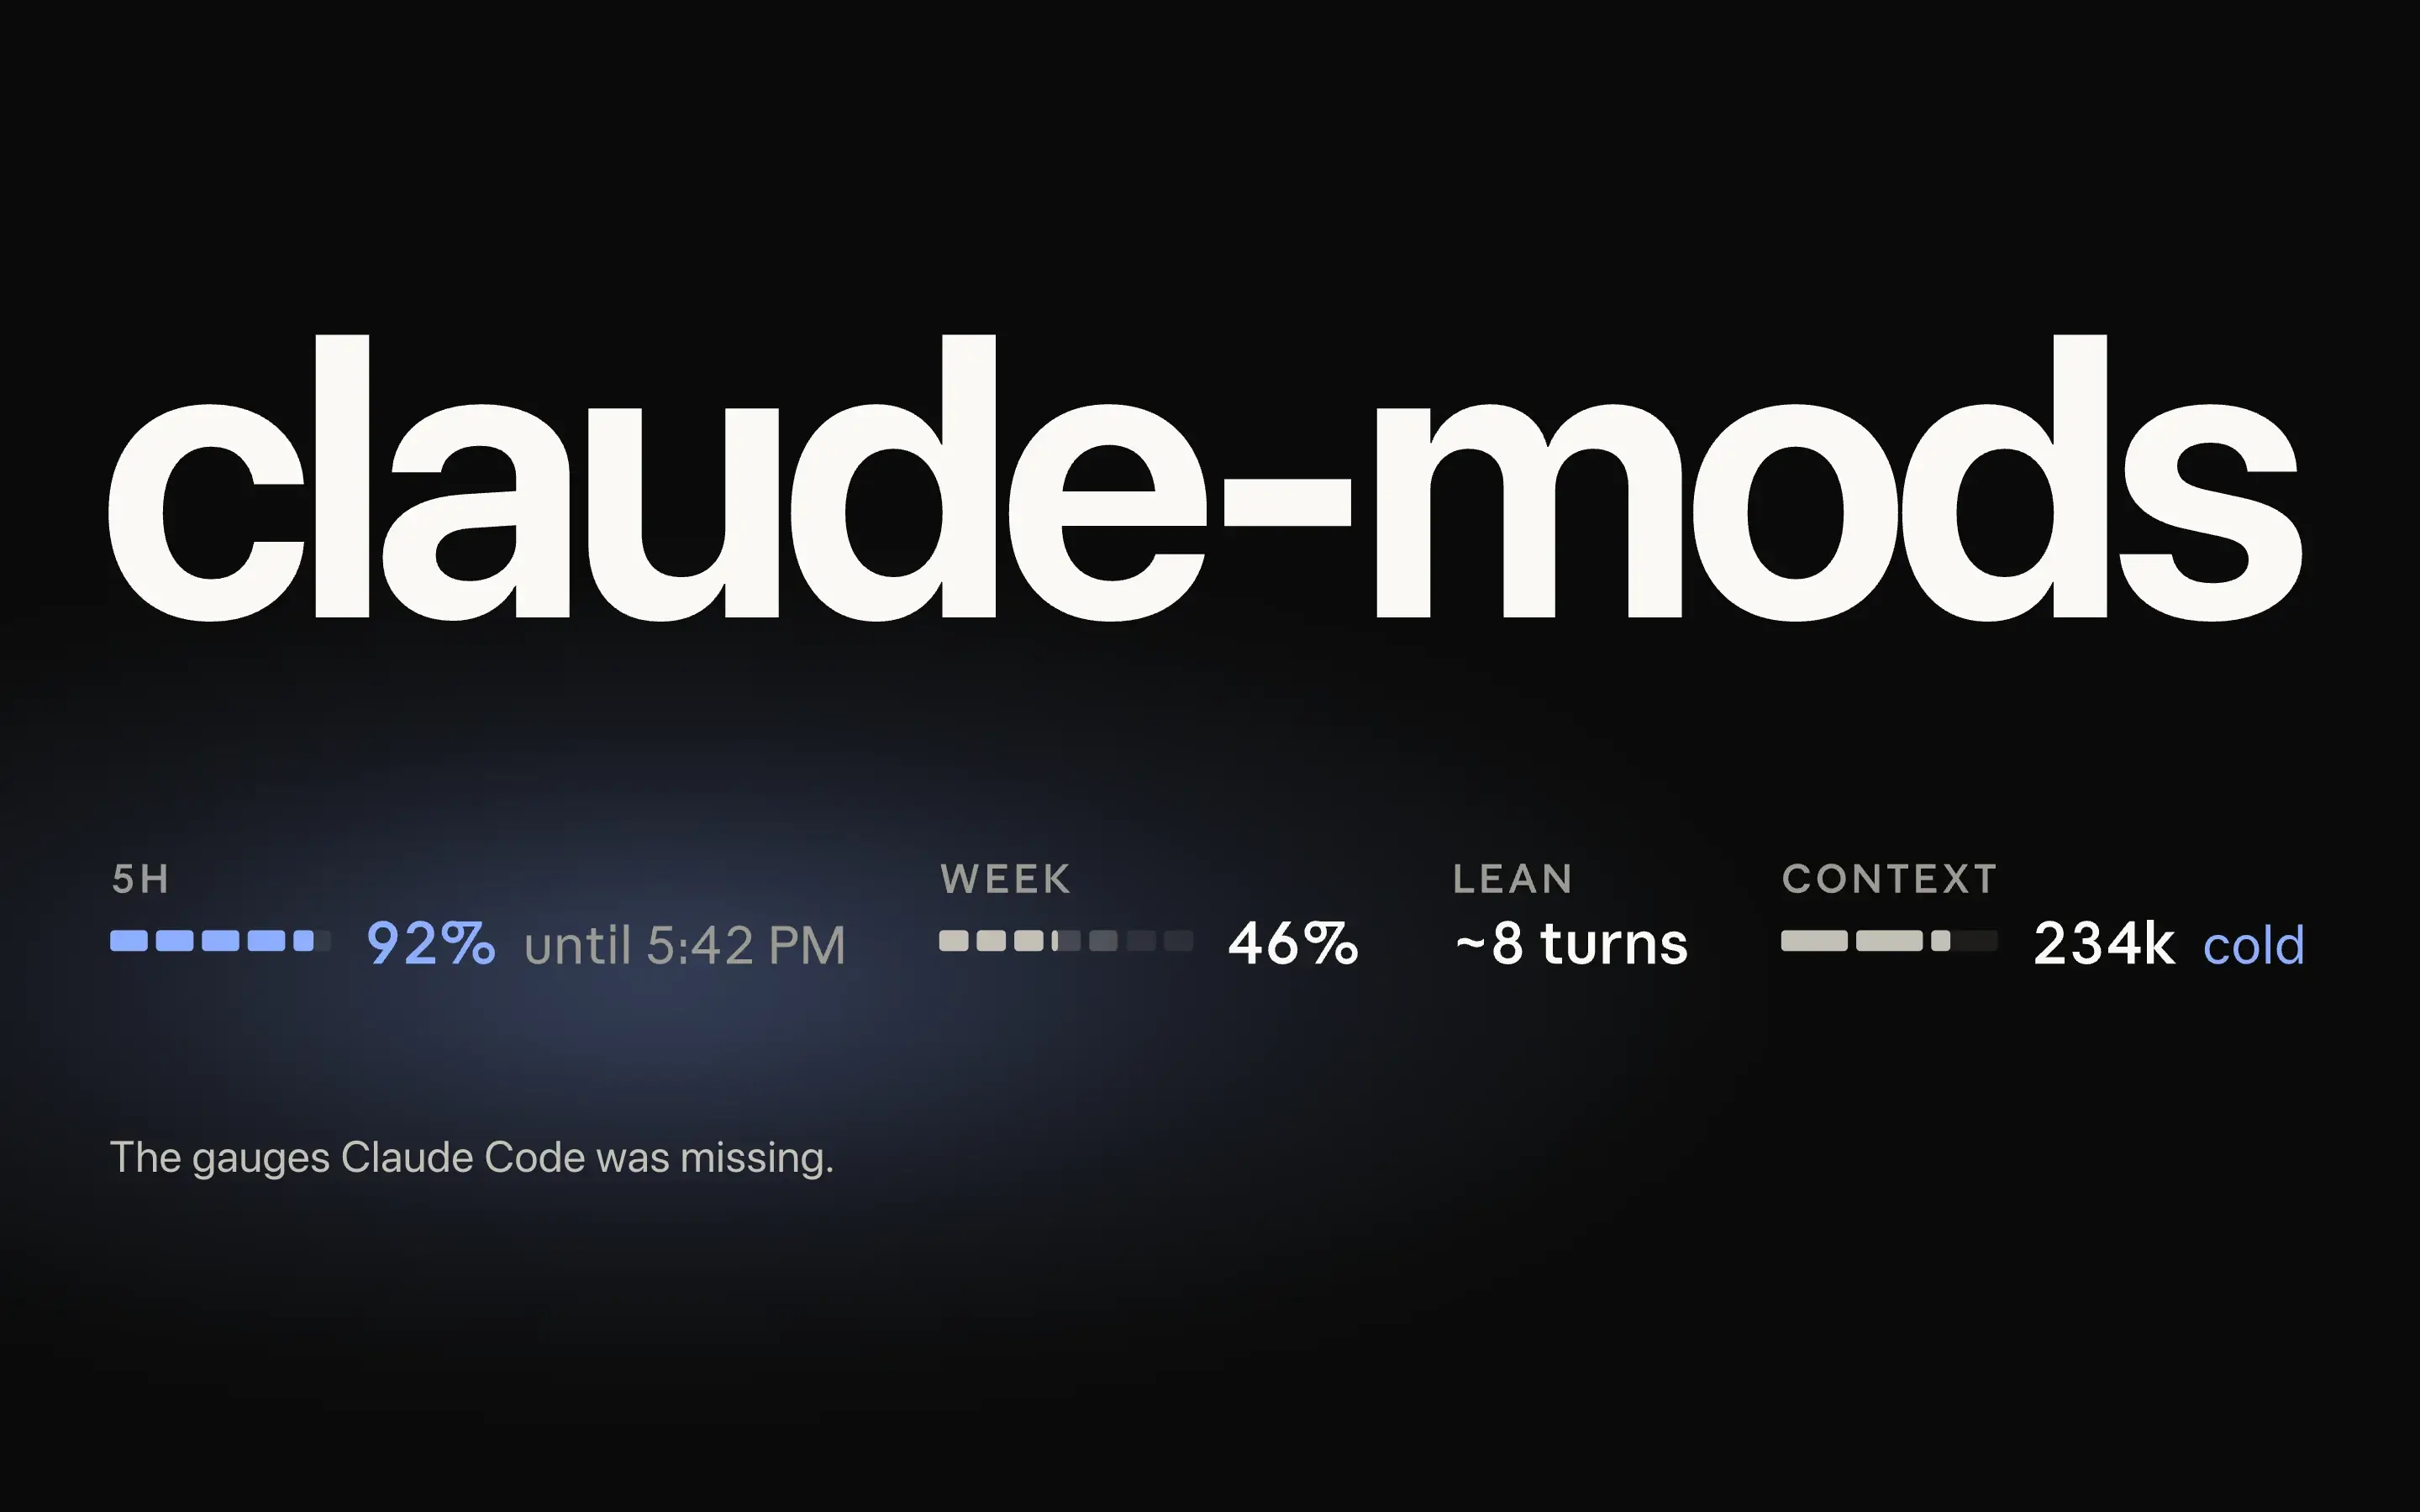
Usage meters and a sidebar of every session, bolted onto the Claude Code app.
Why it exists
Once I had a few Claude Code sessions open, I'd lose the thread. How much of my usage window was left? Which session had stopped to ask me something? I wanted both answers on screen without going looking.
What it does
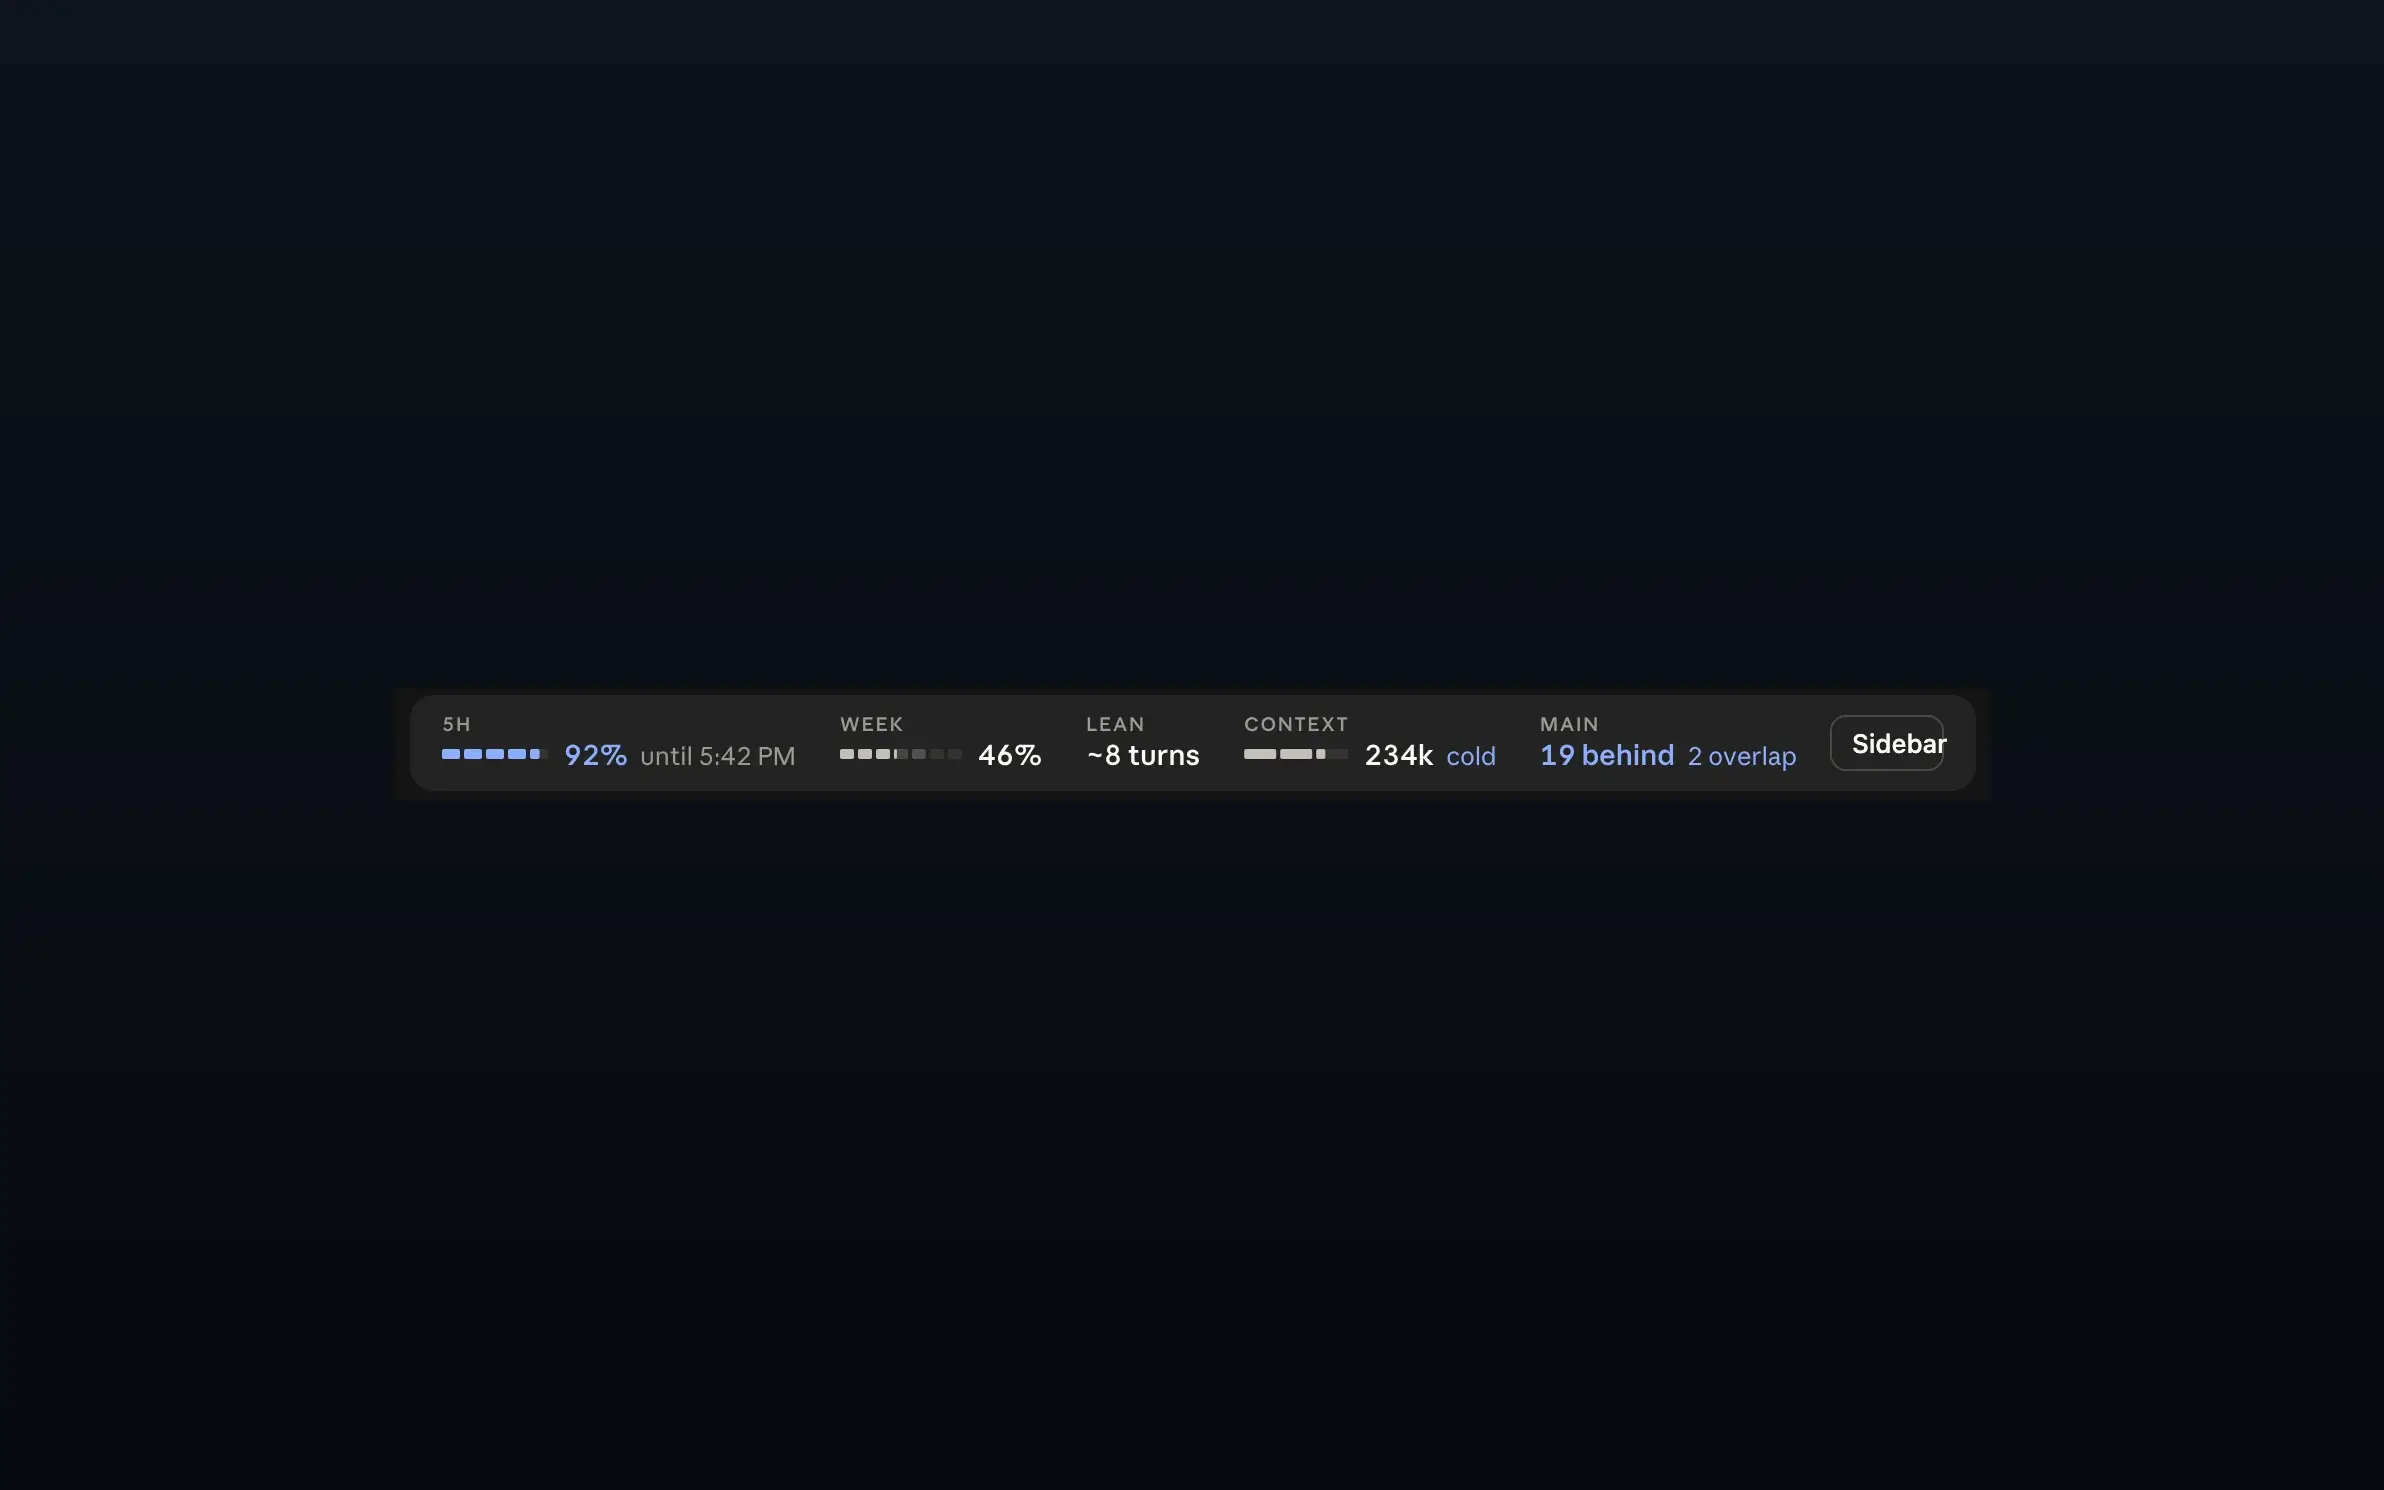
- You see what's left before you run out. A band above the prompt shows five-hour and weekly usage and context, plus the session's cost, running agents, changed files and how far the branch has drifted from main.
- No more opening every session to find the one that's waiting. A sidebar lists each session and the repo's worktrees, turns each question into answer chips, and sends your replies from one tray.
- House rules run as hooks. Try a force push or skip a check, and the hook says no before anything happens.
Under the hood
Everything rides inside the Claude Code desktop app as one TypeScript plugin. The fussy part was the type. A small Python tool traces the app's own typeface into SVG, so the band's numbers look like they shipped with the app.
What I learned
Once, the sidebar grew so big that the app quietly stopped showing it. I added a test that caps how big it can get, so the next time it breaks in testing instead of on my screen.
- Role
- Design, build
- Platforms
- Claude Code desktop app
- Stack
- TypeScript, Python
- Status
- Live
- Year
- 2026